Thailand Tourism Statistics 2026: 25.46 Million International Arrivals (Jan–Oct), Down 4.59%
Thailand recorded 25,464,306 international arrivals from January to October 2026, down 4.59% from 26,689,068 in the same period of 2025. China has returned as the largest source market, up 12.4%, while arrivals from Malaysia, South Korea and several ASEAN markets fell. Hotel occupancy has held close to 2025 levels.
Key figures
- International arrivals, Jan–Oct 2026: 25,464,306 (−4.59% on 2025)
- Largest market: China (4,244,376, +12.4%), ahead of Malaysia (3,226,484, −16.3%)
- Growing markets in the top 20 include China, Taiwan (+6.7%), Myanmar (+6.5%) and Israel (+4.1%)
- Hotel occupancy, Jan–Sep average: 70.3% (70.4% a year earlier)
International arrivals by month
February, March and May came in above 2025. The other months were lower, with the weakest results in January and September. Monthly figures for October have not yet been published separately; the January–October total above comes from the Ministry’s cumulative count.
International arrivals by month, January–September 2025 and 2026
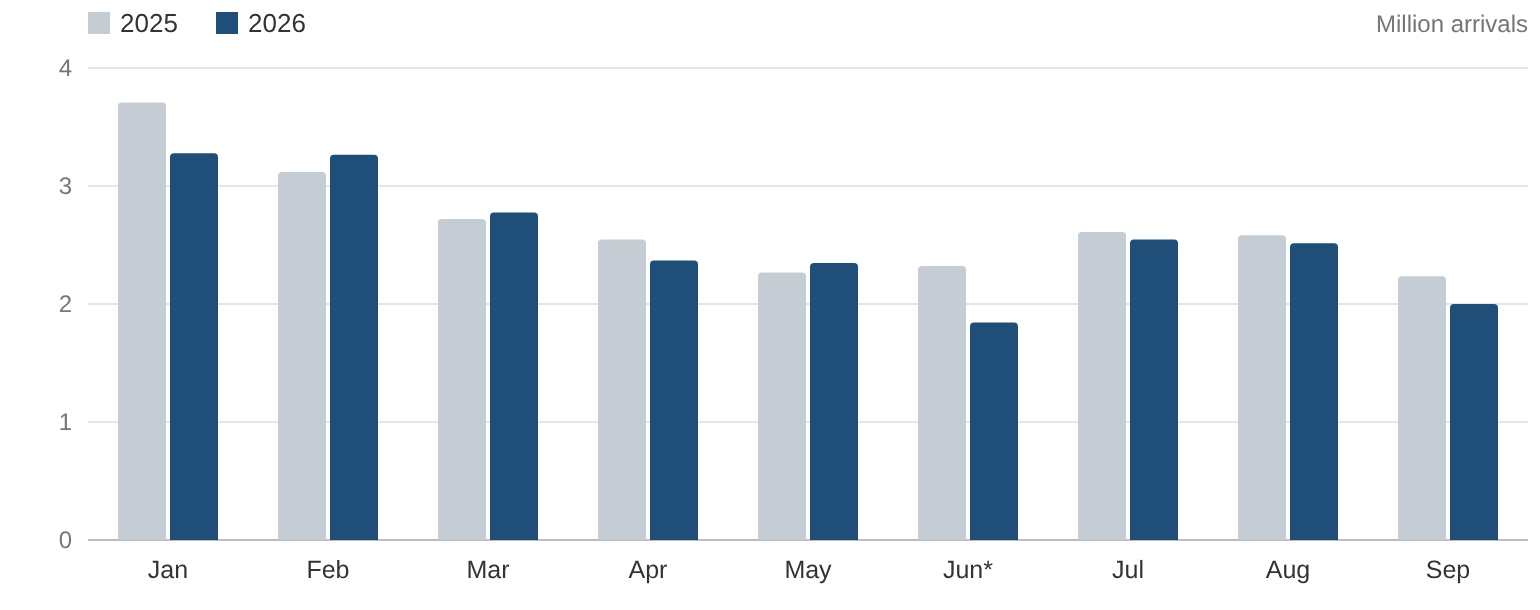
Source: Ministry of Tourism and Sports, Thailand. *June 2026 excludes 22–25 June because of an outage in the Ministry’s recording system.
Thousand arrivals
| Month | 2025 | 2026 | Change |
|---|---|---|---|
| January | 3,709.10 | 3,277.91 | −11.63% |
| February | 3,119.45 | 3,263.80 | +4.63% |
| March | 2,720.46 | 2,775.20 | +2.01% |
| April | 2,547.12 | 2,368.90 | −7.00% |
| May | 2,266.57 | 2,346.85 | +3.54% |
| June* | 2,322.77 | 1,841.55 | −20.72% |
| July | 2,610.37 | 2,545.62 | −2.48% |
| August | 2,583.64 | 2,515.32 | −2.64% |
| September | 2,235.85 | 2,000.34 | −10.53% |
| Jan–Sep | 24,115.33 | 22,935.49 | −4.89% |
*June 2026 excludes 22–25 June (recording system outage), so the June comparison is not like-for-like. Figures for 2026 are preliminary.
Top source markets
China is back in first place after Malaysia led in 2025, with arrivals up 12.4% on the same period last year. Malaysia fell 16.3% and South Korea 26.9%, while India slipped 3.0% and Russia was flat. Among long-haul markets, the United States edged up, and the United Kingdom and Germany slipped about 3%.
Top 10 source markets, January–October 2026 (million arrivals)
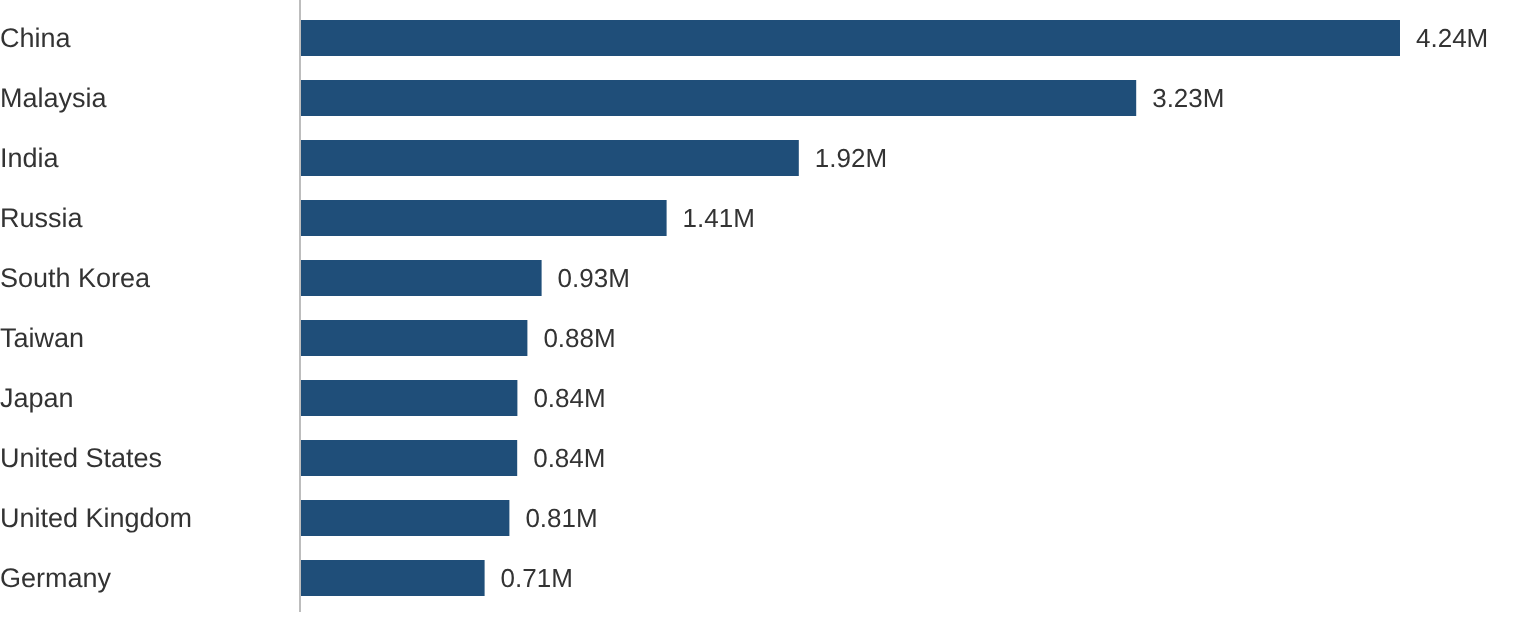
Source: Ministry of Tourism and Sports, Thailand (preliminary).
| # | Market | Jan–Oct 2026 | Share | Jan–Oct 2025 | Change |
|---|---|---|---|---|---|
| 1 | China | 4,244,376 | 16.7% | 3,774,771 | +12.4% |
| 2 | Malaysia | 3,226,484 | 12.7% | 3,856,816 | −16.3% |
| 3 | India | 1,924,417 | 7.6% | 1,984,859 | −3.0% |
| 4 | Russia | 1,414,341 | 5.6% | 1,418,101 | −0.3% |
| 5 | South Korea | 932,066 | 3.7% | 1,274,415 | −26.9% |
| 6 | Taiwan | 877,729 | 3.4% | 822,519 | +6.7% |
| 7 | Japan | 838,893 | 3.3% | 877,574 | −4.4% |
| 8 | United States | 838,365 | 3.3% | 830,539 | +0.9% |
| 9 | United Kingdom | 808,214 | 3.2% | 836,907 | −3.4% |
| 10 | Germany | 712,316 | 2.8% | 733,615 | −2.9% |
| 11 | Singapore | 699,670 | 2.7% | 763,470 | −8.4% |
| 12 | France | 654,188 | 2.6% | 654,455 | −0.0% |
| 13 | Australia | 651,214 | 2.6% | 655,623 | −0.7% |
| 14 | Laos | 617,761 | 2.4% | 746,272 | −17.2% |
| 15 | Myanmar | 581,814 | 2.3% | 546,445 | +6.5% |
| 16 | Hong Kong | 532,595 | 2.1% | 526,422 | +1.2% |
| 17 | Philippines | 521,707 | 2.0% | 575,045 | −9.3% |
| 18 | Vietnam | 509,010 | 2.0% | 566,788 | −10.2% |
| 19 | Indonesia | 506,375 | 2.0% | 658,351 | −23.1% |
| 20 | Israel | 355,266 | 1.4% | 341,114 | +4.1% |
| Rest of the world | 4,017,505 | 15.8% | 4,244,967 | −5.4% | |
| Total | 25,464,306 | 100.0% | 26,689,068 | −4.59% |
Hotel occupancy and room rates
Nationwide occupancy averaged 70.3% from January to September 2026, almost unchanged from 70.4% a year earlier. The North and Northeast filled slightly more rooms, while the South and Central regions eased. Room rates rose in the South and Central regions but fell in the North and Northeast.
| Region | Occupancy 2025 | Occupancy 2026 | Change (pts) | Room rate 2026 (THB) | Change |
|---|---|---|---|---|---|
| Central (incl. Bangkok) | 71.8% | 71.5% | −0.2 | 2,070 | +1.0% |
| South | 73.7% | 73.0% | −0.7 | 2,385 | +3.9% |
| North | 62.3% | 63.4% | +1.1 | 1,447 | −3.0% |
| Northeast | 65.9% | 66.7% | +0.8 | 778 | −15.7% |
| All regions | 70.4% | 70.3% | −0.1 | 1,886 | +1.4% |
Source: Bank of Thailand tourism indicators, based on Ministry of Tourism and Sports data. January–September averages of monthly figures; June–September 2026 are preliminary.
Related statistics
- Thailand Tourism Statistics 2025: full-year arrivals, markets and spending
- Bangkok Tourism Statistics 2026: arrivals handled by travel agencies at Bangkok’s airports
Sources and notes
- January–October total: Ministry of Tourism and Sports, Thailand, cumulative arrivals to 31 October 2026 (released early November 2026).
- Monthly arrivals and markets: Ministry of Tourism and Sports, Thailand, preliminary 2026 data; 2025 comparisons use the Ministry’s final figures.
- Hotel indicators: Bank of Thailand tourism indicators.