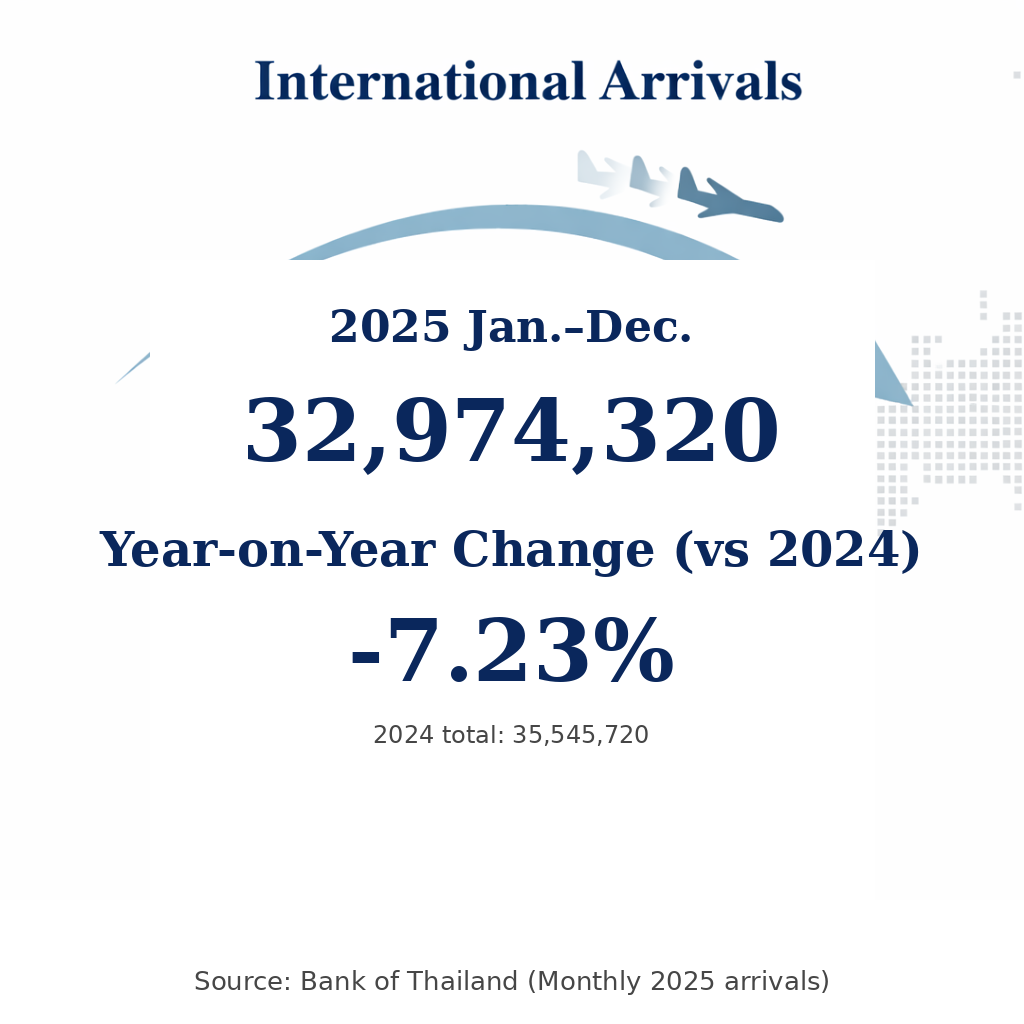
Thailand Tourism Statistics 2025: 32,974,32 International Arrivals, Down 7.23%
Thailand welcomes 32.97 million international arrivals in 2025, down 7.23% from 35.55 million in 2024. Monthly arrivals ranged from 2.24 million (Sep 2025) to 3.71 million (Jan 2025), while hotel indicators point to a strong year-end: occupancy reached 78.05% in Dec 2025, with average room rates around THB 1,972 per room. This article summarizes the 2025 vs 2024 monthly arrivals and key accommodation indicators based on Thailand’s official tourism statistics.
2025 Visitor Arrivals to Thailand
- Unit: thousand persons.
- Source: BOT tourism indicators (compiled from the Ministry of Tourism and Sports).
| Month | International Arrivals (Nationwide) | Growth Rate (%) 2025 |
|
|---|---|---|---|
| 2024 (thousand) |
2025 (thousand) |
||
| Jan. | 3,035.30 | 3,709.10 | +22.20 |
| Feb. | 3,352.30 | 3,119.45 | -6.95 |
| Mar. | 2,982.72 | 2,720.46 | -8.79 |
| Apr. | 2,757.13 | 2,547.12 | -7.62 |
| May | 2,633.46 | 2,266.57 | -13.93 |
| Jun. | 2,740.37 | 2,322.77 | -15.24 |
| Jul. | 3,103.42 | 2,610.37 | -15.89 |
| Aug. | 2,963.15 | 2,583.64 | -12.81 |
| Sep. | 2,521.01 | 2,235.85 | -11.31 |
| Oct. | 2,679.18 | 2,573.74 | -3.93 |
| Nov. | 3,150.24 | 2,914.81 | -7.47 |
| Dec. | 3,627.44 | 3,370.44 | -7.08 |
| Jan.–Dec. | 35,545.72 | 32,974.32 | -7.23 |
Note: Figures are reported in thousands. For example, 3,709.10 equals approximately 3.709 million arrivals.
- Total international arrivals in 2025 were lower than 2024 overall (-7.23%), with softer performance across most months after January.
- The largest year-on-year declines in 2025 occurred during the mid-year period (May to August), based on this national dataset.
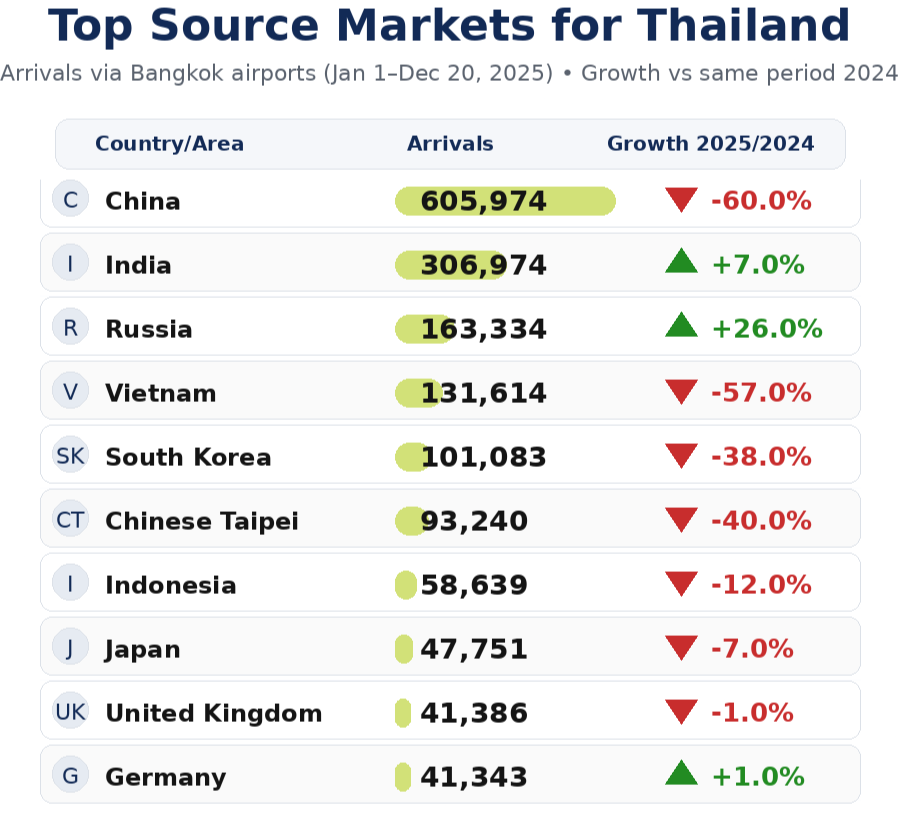
2025 Breakdown of Country/Area (Arrivals at Bangkok airports)
China was the largest source market during the period with 605,974 arrivals (30.8% of the overall total), followed by India with 306,974 arrivals (15.6%) and Russia with 163,334 arrivals (8.3%). The “Other” category represents all remaining source markets outside the top 15 and totals 214,197 arrivals (about 10.9% of the overall total).
| Arrivals by Country/Area (Bangkok Airports, 2025) – ATTA | Comparison vs 2019 | ||||||
|---|---|---|---|---|---|---|---|
| Country/Area | Visitor Arrivals 2024 |
Visitor Arrivals 2025 |
Change (%) 2025 vs 2024 |
Country/Area | Visitor Arrivals 2019 |
Visitor Arrivals 2025 |
Change (%) 2025 vs 2019 |
| China | 1,519,114 | 605,974 | -60.00% | China | 3,039,966 | 605,974 | -80.00% |
| India | 285,720 | 306,974 | +7.00% | India | 273,217 | 306,974 | +12.00% |
| Russia | 130,139 | 163,334 | +26.00% | Russia | 111,183 | 163,334 | +47.00% |
| Vietnam | 309,340 | 131,614 | -57.00% | Vietnam | 315,797 | 131,614 | -58.00% |
| South Korea | 162,154 | 101,083 | -38.00% | South Korea | 215,836 | 101,083 | -53.00% |
| Chinese Taipei | 156,491 | 93,240 | -40.00% | Chinese Taipei | 108,618 | 93,240 | -14.00% |
| Indonesia | 66,797 | 58,639 | -12.00% | Indonesia | 96,087 | 58,639 | -39.00% |
| Japan | 51,564 | 47,751 | -7.00% | Japan | 170,192 | 47,751 | -72.00% |
| United Kingdom | 42,008 | 41,386 | -1.00% | United Kingdom | 63,764 | 41,386 | -35.00% |
| Germany | 40,841 | 41,343 | +1.00% | Germany | 45,842 | 41,343 | -10.00% |
| Spain | 45,312 | 40,704 | -10.00% | Spain | 27,581 | 40,704 | +48.00% |
| France | 39,552 | 40,517 | +2.00% | France | 41,590 | 40,517 | -3.00% |
| Australia | 33,421 | 32,320 | -3.00% | Australia | 30,859 | 32,320 | +5.00% |
| Philippines | 23,977 | 28,901 | +21.00% | Philippines | 18,170 | 28,901 | +59.00% |
| Malaysia | 25,295 | 22,598 | -11.00% | Malaysia | 27,346 | 22,598 | -17.00% |
| Other | 214,197 | Other | 214,197 | ||||
Sources and Notes
https://app.bot.or.th/BTWS_STAT/statistics/ReportPage.aspx?reportID=875&language=eng