Bangkok Tourism Statistics 2026: 987,528 Arrivals via ATTA Members (Jan–Jun), Down 9.26%
Members of the Association of Thai Travel Agents (ATTA) received 987,528 international tourists at Bangkok’s two main airports, Suvarnabhumi and Don Mueang, from 1 January to 30 June 2026. This is down 9.26% from the same period in 2025 (1,088,360) and 64.56% below the same period in 2019 (2,786,101). China remained the largest source market with 343,984 tourists (34.8% of the total), followed by India and Russia.
Important: ATTA figures count only tourists received by ATTA member travel agencies at the two Bangkok airports, mostly tour groups and agency-arranged travelers. They are not total arrivals to Bangkok or Thailand. For nationwide arrival numbers, see Thailand Tourism Statistics 2026.
Key highlights
- Total ATTA-handled arrivals (1 Jan–30 Jun 2026): 987,528
- Change vs same period 2025: -9.26%; vs 2019: -64.56%
- Largest source market: China (343,984; 34.8% share)
- Next largest markets: India (144,685; 14.7%), Russia (100,465; 10.2%)
- Other markets (outside top 15): 102,312 (10.4%)
Monthly trend in 2026
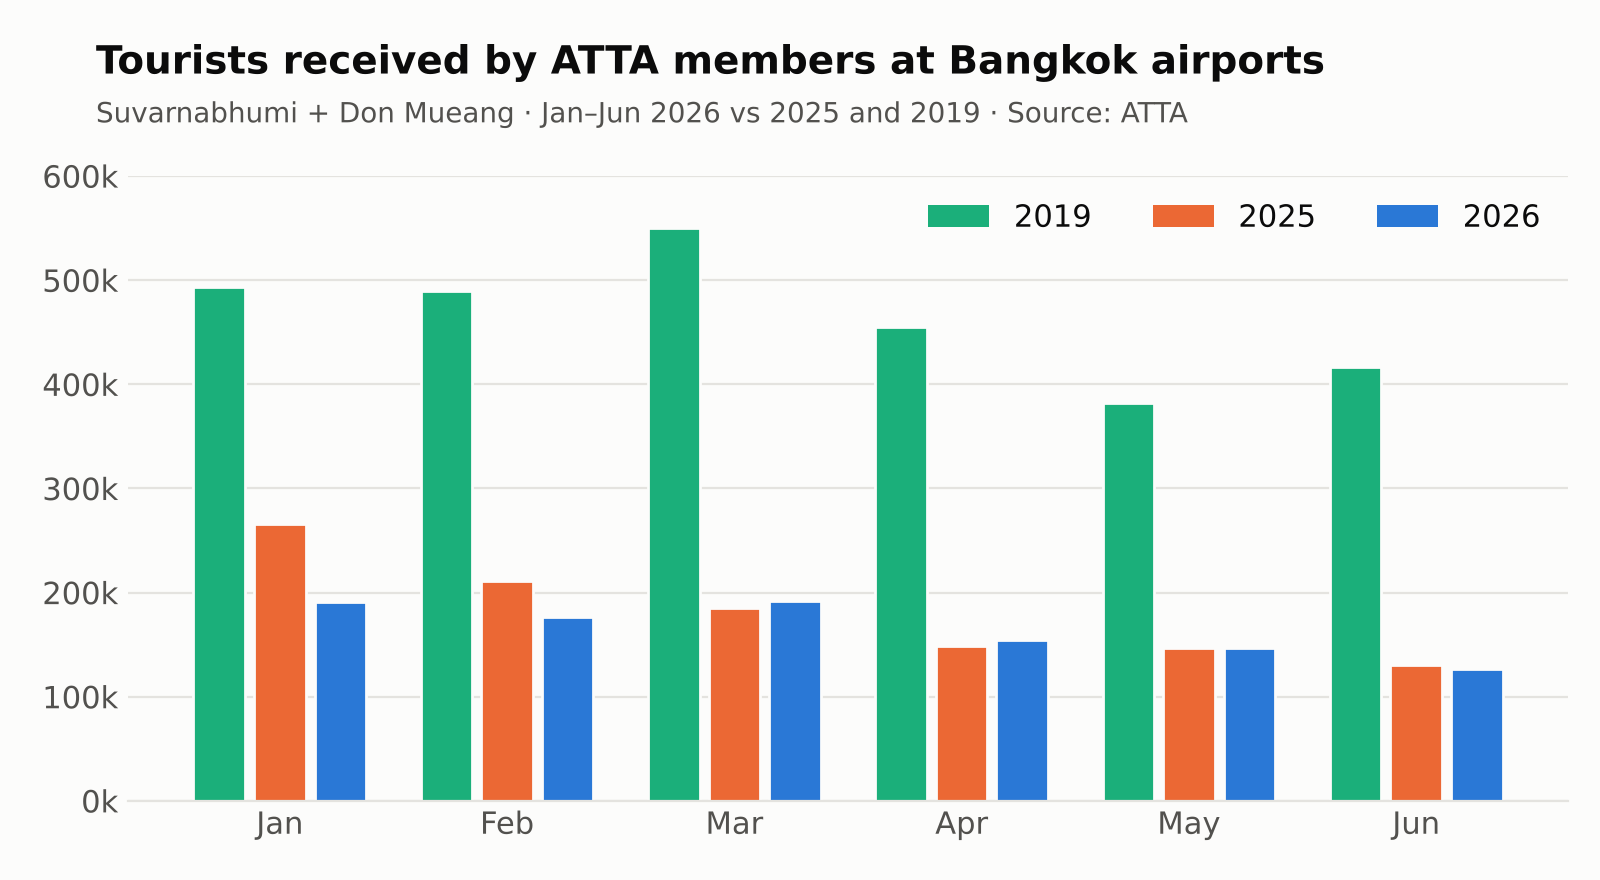
The first half of 2026 started weakly, with January (-28.33%) and February (-16.61%) well below 2025. From March to May, volumes recovered to slightly above 2025 levels, before easing again in June (-2.93%). March was the strongest month by volume in 2026 (192,232). Every month remained 61–70% below 2019.
| Month | ATTA-handled arrivals (Suvarnabhumi + Don Mueang) | Change (%) | ||||
|---|---|---|---|---|---|---|
| 2026 | 2025 | 2024 | 2019 | 2026 vs 2025 | 2026 vs 2019 | |
| January | 190,820 | 266,265 | 270,123 | 492,967 | -28.33% | -61.29% |
| February | 176,202 | 211,296 | 278,701 | 489,938 | -16.61% | -64.04% |
| March | 192,232 | 185,093 | 335,132 | 549,587 | +3.86% | -65.02% |
| April | 154,568 | 148,302 | 273,827 | 455,289 | +4.23% | -66.05% |
| May | 146,858 | 146,722 | 300,968 | 382,116 | +0.09% | -61.57% |
| June | 126,848 | 130,682 | 249,815 | 416,204 | -2.93% | -69.52% |
| Total | 987,528 | 1,088,360 | 1,708,566 | 2,786,101 | -9.26% | -64.56% |
Top source markets
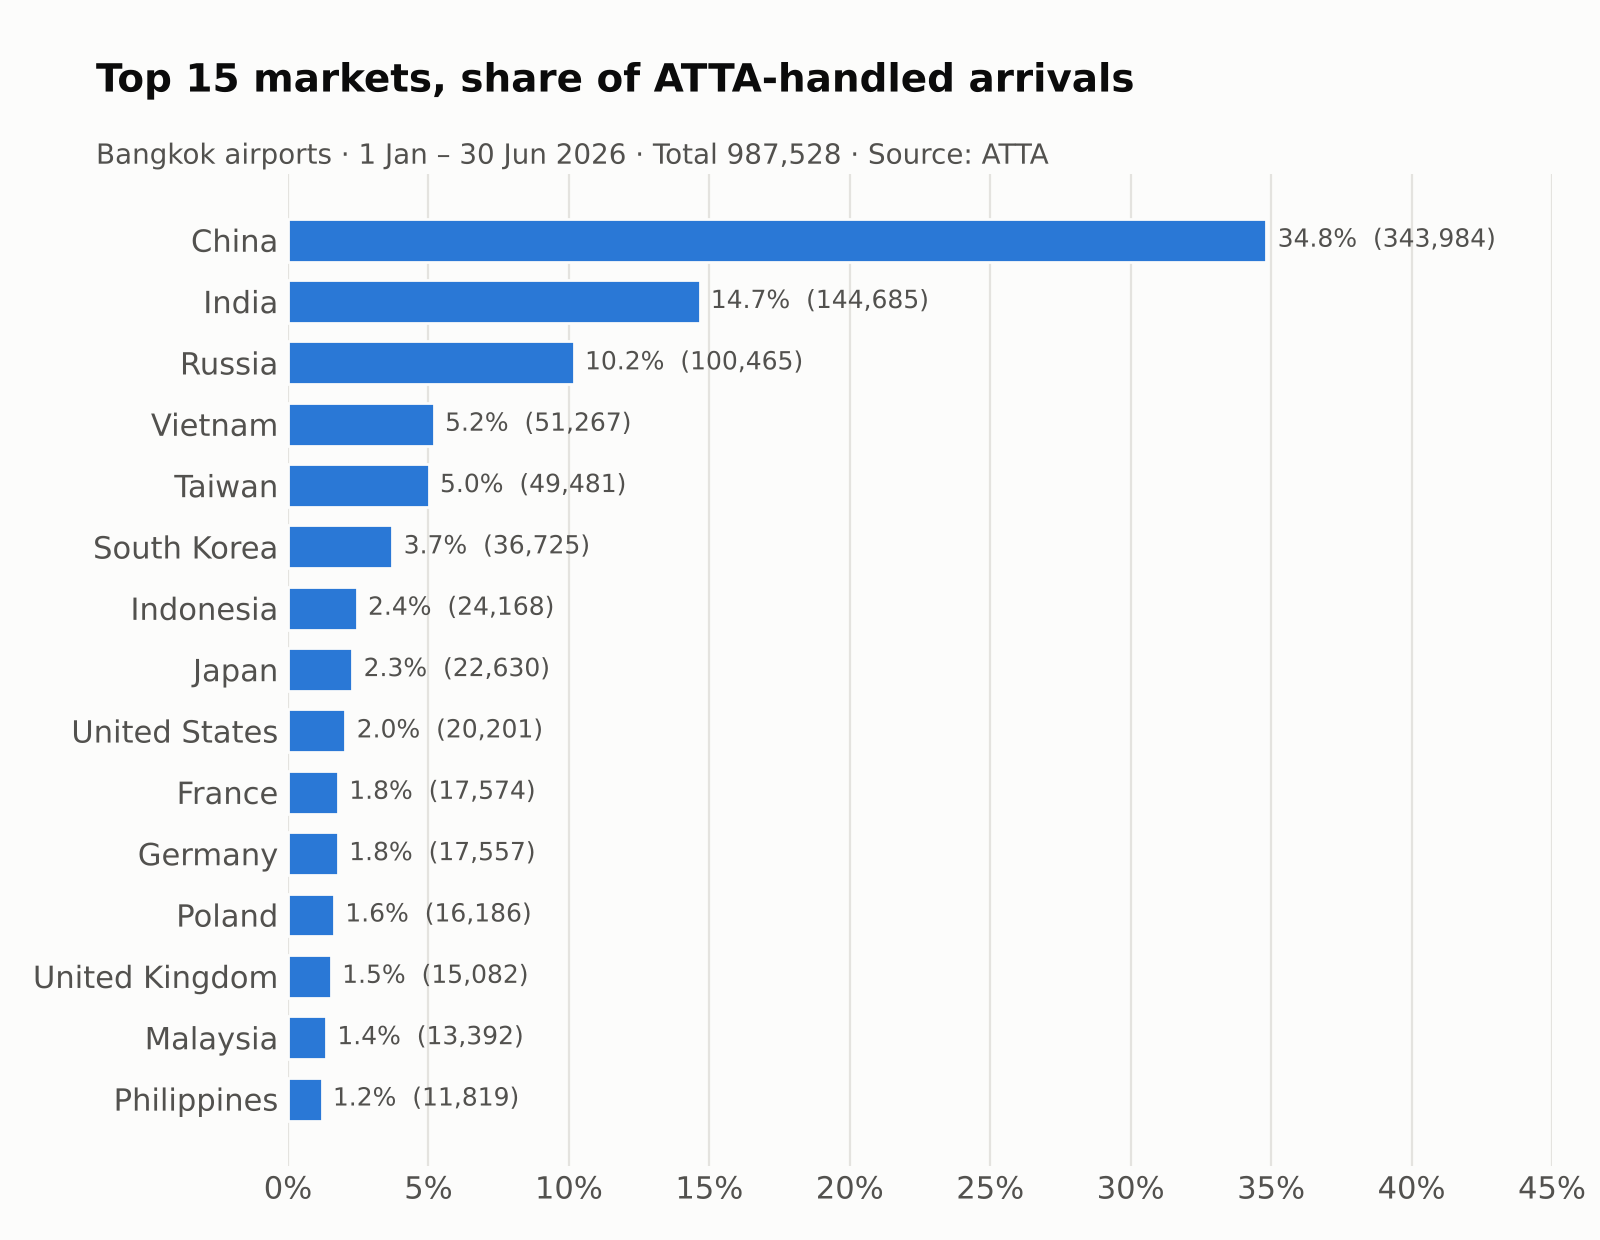
ATTA-handled arrivals remain concentrated in a few markets: the top three account for 59.7% of the total. China was almost flat versus 2025 but still around 79% below 2019. Russia, Poland, Malaysia, the United States and Taiwan grew year-on-year, while Vietnam, South Korea, the United Kingdom and most Western European markets declined.
| Rank | Market | Arrivals (1 Jan–30 Jun) | Change (%) | Share of total (2026) | |||
|---|---|---|---|---|---|---|---|
| 2026 | 2025 | 2019 | 2026/2025 | 2026/2019 | |||
| 1 | China | 343,984 | 349,603 | 1,623,892 | -1.6% | -78.8% | 34.8% |
| 2 | India | 144,685 | 148,630 | 140,885 | -2.7% | +2.7% | 14.7% |
| 3 | Russia | 100,465 | 86,156 | 75,390 | +16.6% | +33.3% | 10.2% |
| 4 | Vietnam | 51,267 | 85,893 | 162,160 | -40.3% | -68.4% | 5.2% |
| 5 | Taiwan | 49,481 | 48,016 | 53,596 | +3.1% | -7.7% | 5.0% |
| 6 | South Korea | 36,725 | 58,129 | 117,355 | -36.8% | -68.7% | 3.7% |
| 7 | Indonesia | 24,168 | 34,233 | 45,346 | -29.4% | -46.7% | 2.4% |
| 8 | Japan | 22,630 | 26,661 | 67,154 | -15.1% | -66.3% | 2.3% |
| 9 | United States | 20,201 | 18,418 | 17,029 | +9.7% | +18.6% | 2.0% |
| 10 | France | 17,574 | 23,689 | 26,443 | -25.8% | -33.5% | 1.8% |
| 11 | Germany | 17,557 | 25,805 | 26,221 | -32.0% | -33.0% | 1.8% |
| 12 | Poland | 16,186 | 12,033 | 5,257 | +34.5% | +207.9% | 1.6% |
| 13 | United Kingdom | 15,082 | 24,811 | 36,963 | -39.2% | -59.2% | 1.5% |
| 14 | Malaysia | 13,392 | 11,300 | 13,971 | +18.5% | -4.1% | 1.4% |
| 15 | Philippines | 11,819 | 16,692 | 9,785 | -29.2% | +20.8% | 1.2% |
| Other | 102,312 | 10.4% | |||||
Note: Percentage changes are calculated from the ATTA figures for the same period (1 January–30 June) of each year.
Arrivals by region
| Region | Arrivals (1 Jan–30 Jun) | Change (%) | |||
|---|---|---|---|---|---|
| 2026 | 2025 | 2019 | 2026/2025 | 2026/2019 | |
| Asia | 722,412 | 799,490 | 2,303,555 | -9.6% | -68.6% |
| Russia & CIS | 101,513 | 87,723 | 87,476 | +15.7% | +16.0% |
| Western Europe | 55,866 | 82,066 | 96,895 | -31.9% | -42.3% |
| Southern Europe | 22,804 | 37,888 | 21,547 | -39.8% | +5.8% |
| North America | 22,162 | 20,676 | 17,911 | +7.2% | +23.7% |
| Eastern Europe | 19,320 | 14,485 | 6,505 | +33.4% | +197.0% |
| Central & South America | 7,738 | 7,292 | 2,588 | +6.1% | +199.0% |
| Northern Europe | 3,959 | 6,763 | 4,829 | -41.5% | -18.0% |
| Middle East | 3,406 | 4,637 | 5,688 | -26.5% | -40.1% |
| Australia & New Zealand | 3,058 | 4,737 | 8,203 | -35.4% | -62.7% |
| Africa | 297 | 553 | 471 | -46.3% | -36.9% |
Note: Regional totals follow ATTA’s market groupings and do not add up exactly to the overall total.
What the 2026 data suggests
- Agency-handled arrivals at Bangkok’s airports fell 9.26% year-on-year in the first half of 2026, with the decline concentrated in January and February.
- Asia still dominates (73.2% of the total), but Russia & CIS (+15.72%), Eastern Europe (+33.38%) and North America (+7.19%) were the main growth regions.
- Group and agency-arranged travel remains far below pre-pandemic levels (-64.56% vs 2019), especially from China, Japan and South Korea.
Sources
- Association of Thai Travel Agents (ATTA), Statistics: International Tourists Arriving in Thailand as of 30 June 2026: atta.or.th