Bangkok Tourism Statistics 2025: 1,970,575 International Arrivals, Down 37.33%
Bangkok’s two main airports - Suvarnabhumi Airport and Don Mueang International Airport - recorded 1,970,575 international arrivals from 1 January to 20 December 2025, based on figures published by the Association of Thai Travel Agents (ATTA). This is -37.33% versus the same period in 2024 (3,144,501) and -62.29% versus the same period in 2019 (5,225,350).
Key highlights
- Total arrivals (Jan 1–Dec 20, 2025): 1,970,575
- Airport split: Suvarnabhumi 1,540,683 (78.2%) and Don Mueang 429,892 (21.8%)
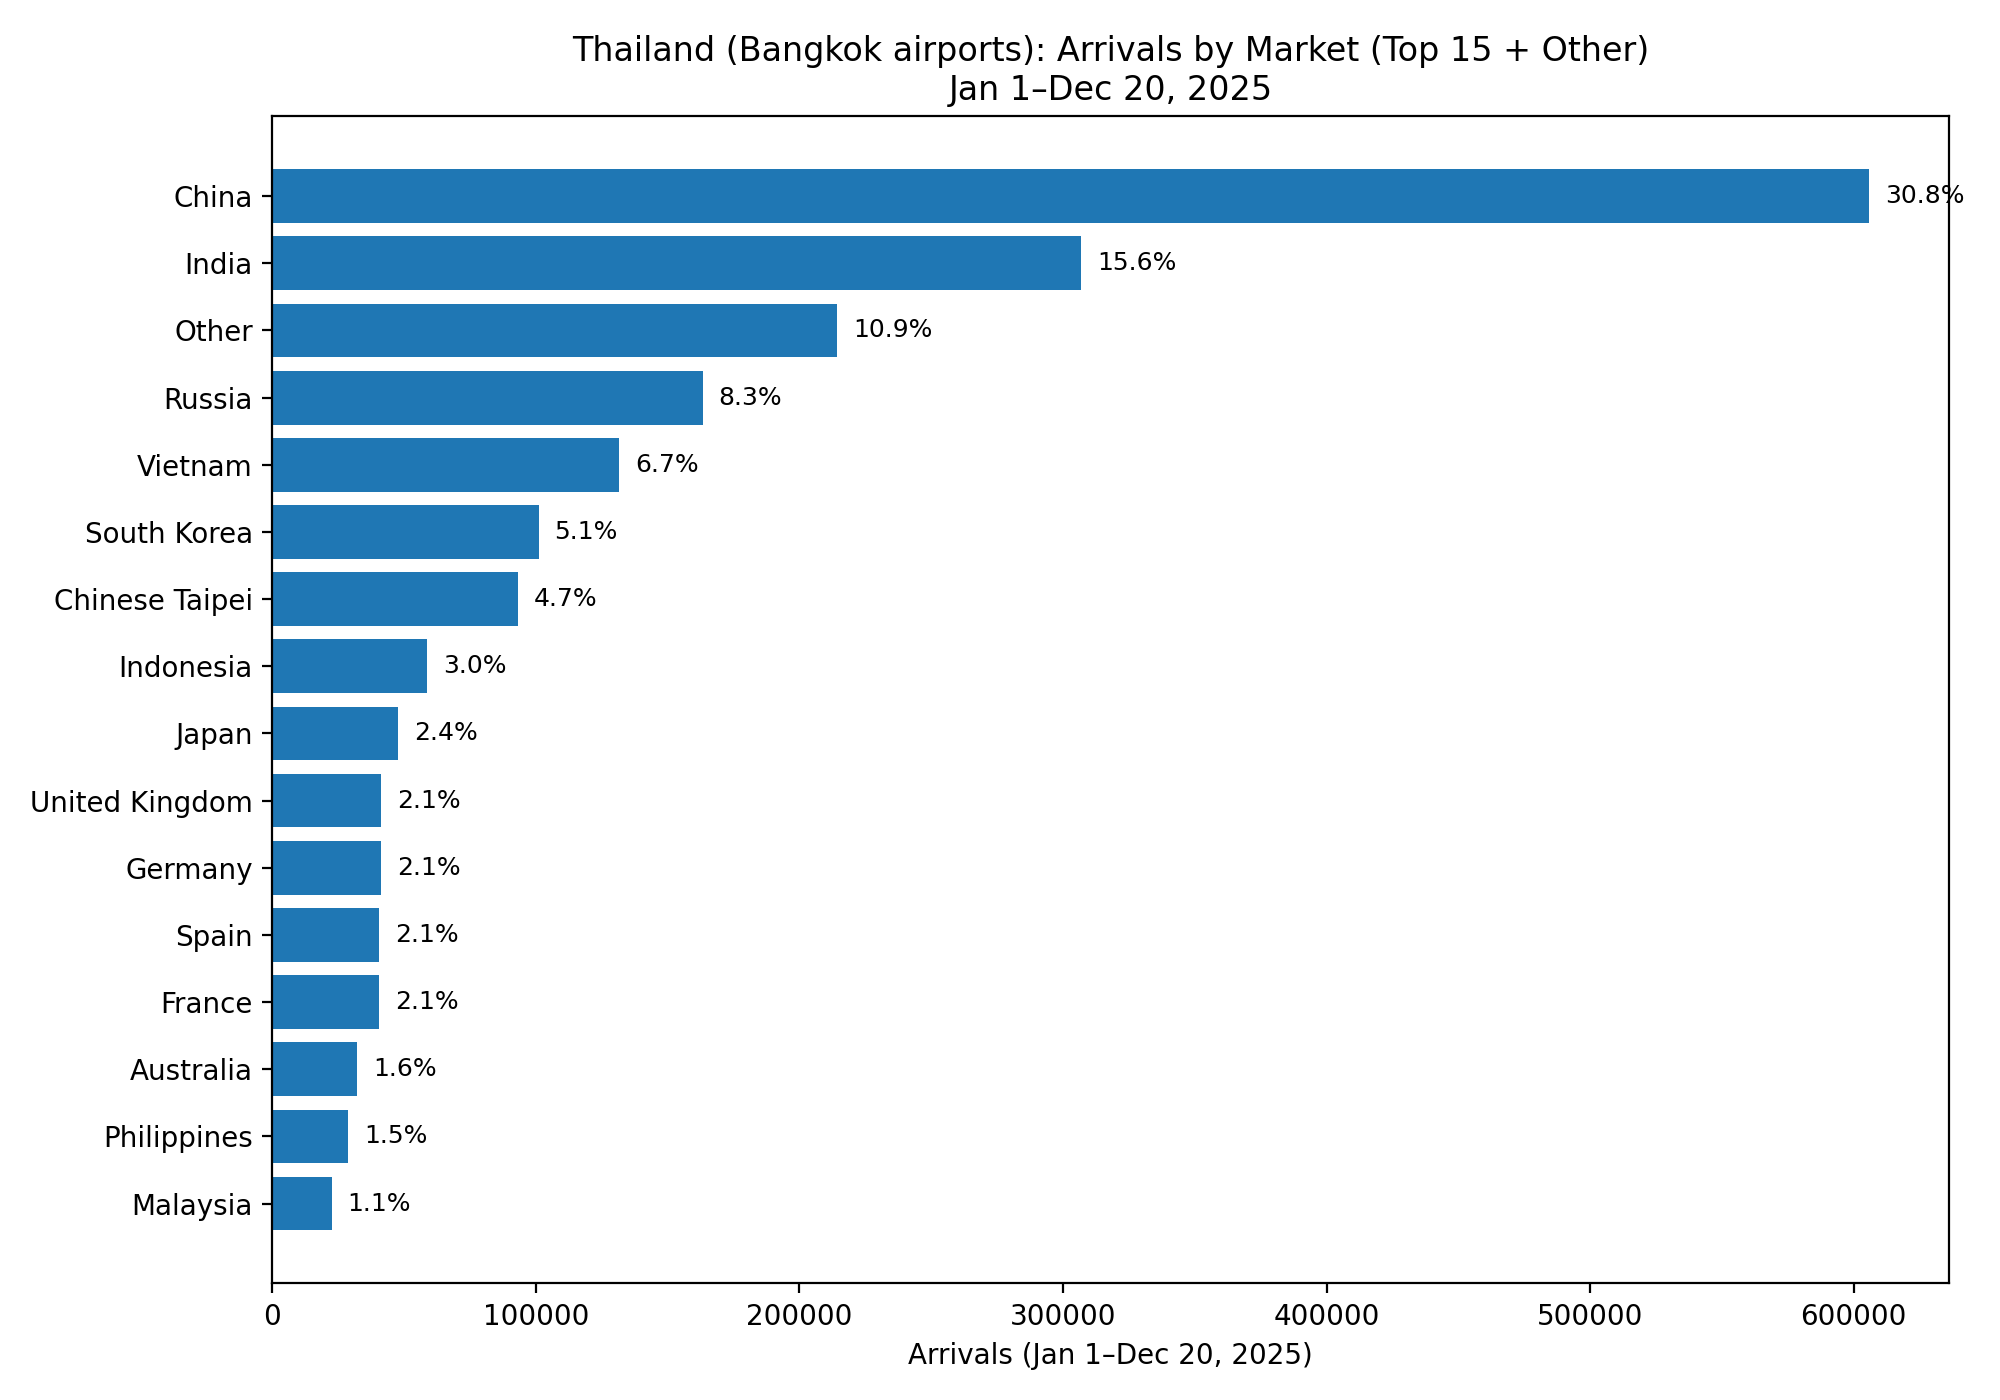
- Largest source market: China (605,974; 30.8% share)
- Next largest markets: India (306,974; 15.6%), Russia (163,334; 8.3%)
- Other markets (outside top 15): 214,197 (10.9%)
Monthly trend in 2025
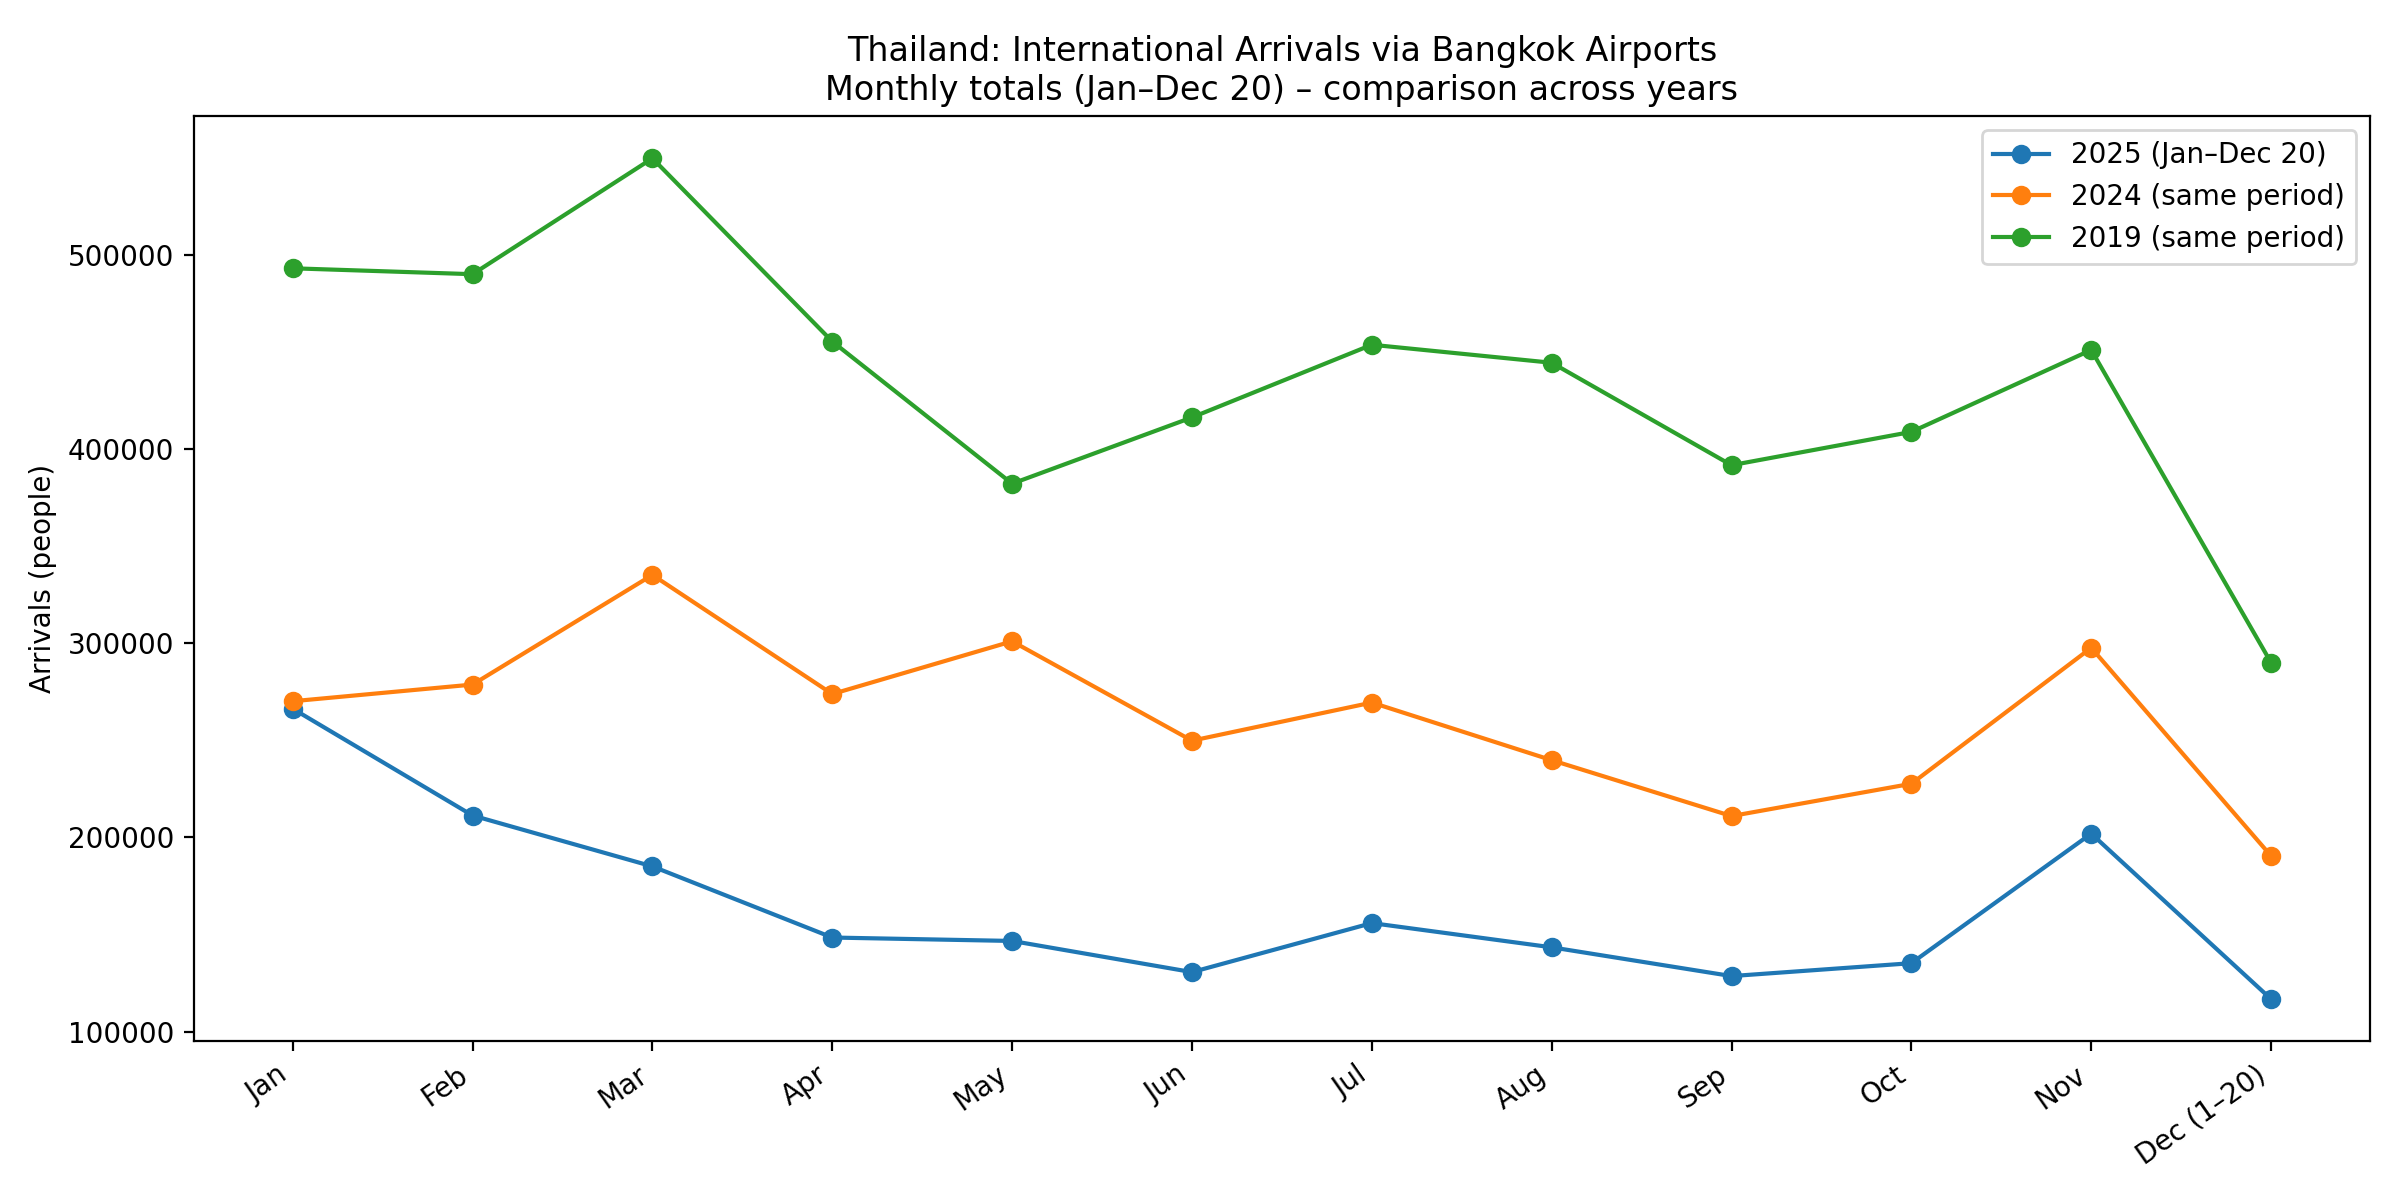
The monthly pattern indicates a softer year overall, with most months below 2024 levels. January was broadly stable versus 2024 (-1.43%), while February through October remained materially lower year-on-year. November was the strongest month by volume in 2025 (201,967). December figures cover only 1-20 December and should be read as a partial-month total.
| Month | Bangkok airports breakdown | Total arrivals (same period) | ||||
|---|---|---|---|---|---|---|
| Suvarnabhumi | Don Mueang | Total 2025 | Total 2024 | Total 2019 | YoY (2025 vs 2024) | |
| January | 199,358 | 66,907 | 266,265 | 270,123 | 492,967 | -1.43% |
| February | 164,889 | 46,407 | 211,296 | 278,701 | 489,938 | -24.19% |
| March | 149,023 | 36,070 | 185,093 | 335,132 | 549,587 | -44.77% |
| April | 112,487 | 35,995 | 148,482 | 273,827 | 455,289 | -45.78% |
| May | 110,046 | 36,676 | 146,722 | 300,968 | 382,116 | -51.25% |
| June | 101,884 | 28,798 | 130,682 | 249,815 | 416,204 | -47.69% |
| July | 124,506 | 31,409 | 155,915 | 269,430 | 453,613 | -42.13% |
| August | 110,926 | 32,520 | 143,446 | 239,780 | 444,349 | -40.18% |
| September | 98,448 | 30,194 | 128,642 | 211,005 | 391,619 | -39.03% |
| October | 110,236 | 25,043 | 135,279 | 227,634 | 408,759 | -40.57% |
| November | 166,931 | 35,036 | 201,967 | 297,625 | 450,945 | -32.14% |
| December (1–20) | 91,949 | 24,837 | 116,786 | 190,461 | 289,964 | -38.68% |
| Total | 1,540,683 | 429,892 | 1,970,575 | 3,144,501 | 5,225,350 | -37.33% |
Top source markets
Bangkok airport arrivals were concentrated in a small number of markets. China remained the largest source market (30.8% share) but was substantially below the same period in 2024 and 2019. India and Russia performed relatively strongly versus 2024 in this dataset, while several mature markets remained broadly stable-to-soft year-on-year.
| Rank | Market | Arrivals | Change (%) | Share of total (2025) | |||
|---|---|---|---|---|---|---|---|
| 2025 | 2024 | 2019 | 2025/2024 | 2025/2019 | |||
| 1 | China | 605,974 | 1,519,114 | 3,039,966 | -60% | -80% | 30.8% |
| 2 | India | 306,974 | 285,720 | 273,217 | +7% | +12% | 15.6% |
| 3 | Russia | 163,334 | 130,139 | 111,183 | +26% | +47% | 8.3% |
| 4 | Vietnam | 131,614 | 309,340 | 315,797 | -57% | -58% | 6.7% |
| 5 | South Korea | 101,083 | 162,154 | 215,836 | -38% | -53% | 5.1% |
| 6 | Chinese Taipei | 93,240 | 156,491 | 108,618 | -40% | -14% | 4.7% |
| 7 | Indonesia | 58,639 | 66,797 | 96,087 | -12% | -39% | 3.0% |
| 8 | Japan | 47,751 | 51,564 | 170,192 | -7% | -72% | 2.4% |
| 9 | United Kingdom | 41,386 | 42,008 | 63,764 | -1% | -35% | 2.1% |
| 10 | Germany | 41,343 | 40,841 | 45,842 | +1% | -10% | 2.1% |
| 11 | Spain | 40,704 | 45,312 | 27,581 | -10% | +48% | 2.1% |
| 12 | France | 40,517 | 39,552 | 41,590 | +2% | -3% | 2.1% |
| 13 | Australia | 32,320 | 33,421 | 30,859 | -3% | +5% | 1.6% |
| 14 | Philippines | 28,901 | 23,977 | 18,170 | +21% | +59% | 1.5% |
| 15 | Malaysia | 22,598 | 25,295 | 27,346 | -11% | -17% | 1.1% |
| Other | 214,197 | 10.9% | |||||
What the 2025 data suggests
- International arrivals via Bangkok airports during the period were markedly lower than both 2024 and the pre-pandemic benchmark.
- China remained the largest market by volume, although still far below the same period in 2024 and 2019.
- Suvarnabhumi handled the majority of arrivals, accounting for roughly four out of every five visitors in the period covered.